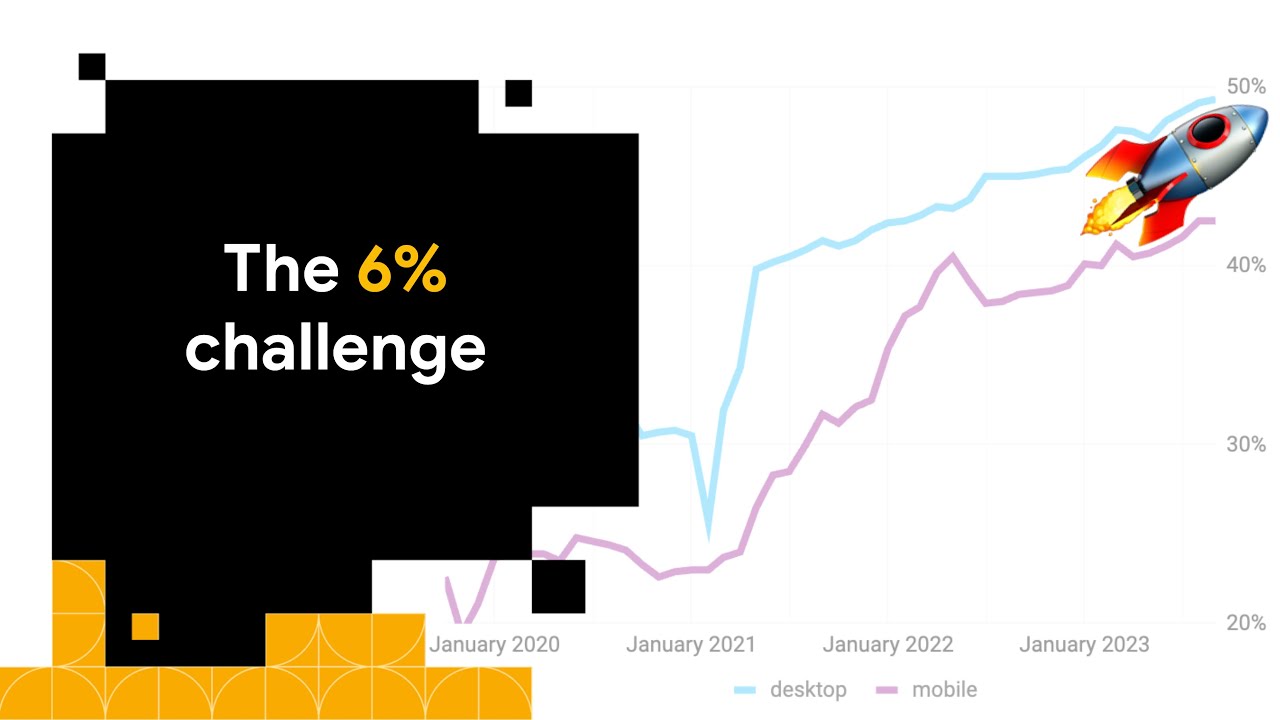
The web is getting faster. In fact, according to HTTP Archive, more websites than ever before are passing the Core Web Vitals assessment, which looks at three metrics that represent different aspects of page performance: loading speed, interaction responsiveness, and layout stability.
Earlier this week, the Chrome team published a retrospective on the Web Vitals program that details some of the browser-level and ecosystem improvements that got us to this point. In the post, the Chrome team reported a savings of 10,000 years worth of waiting thanks to these improvements to Core Web Vitals.
So with 2024 around the corner, I wanted to take a closer look at what it’s going to take to carry this momentum forward and continue making the web even faster.
But there’s a catch. The metric we use to measure interaction responsiveness is changing in 2024. And this new metric is finding a lot of responsiveness issues that have been flying under the radar.
Will we be able to meet this new challenge? Will we be able to do so while keeping pace with the performance improvements of 2023? I think so, but we’re going to need to learn some new tricks.
Why care about web performance
This is a question I often take for granted. I’ve spent the last 11 years working on and advocating for web performance, and sometimes I naively assume that everyone—in my bubble, at least—gets it too.
If we’re going to continue making the web faster, we’re going to need more developers and business leaders to buy in to the idea that performance is a virtue worth doing something about.
So let’s talk about the “why” of web performance.
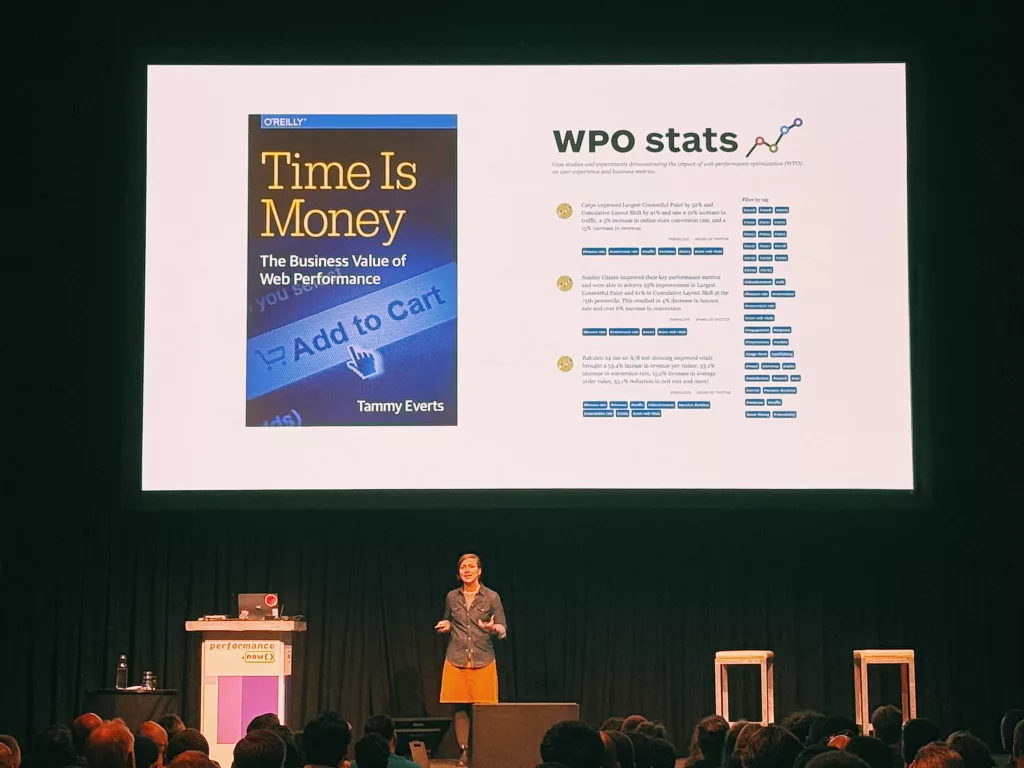
Photo credit: schmitzoide on Twitter
Last week, I had the chance to go to the performance.now() conference in Amsterdam. It’s become an annual pilgrimage for many of us in the web performance industry to convene and talk about pushing the web faster. One of the co-chairs and presenters at the conference was Tammy Everts, who perfectly summed up the answer to this question in the slide pictured above.
In 2016, Tammy published a book called Time is Money in which she lists a few reasons why a site owner might want to care about optimizing web performance:
- Bounce rate
- Cart size
- Conversions
- Revenue
- Time on site
- Page views
- User satisfaction
- User retention
- Organic search traffic
- Brand perception
- Productivity
- Bandwidth/CDN savings
- Competitive advantage
Drawing from decades of experience and volumes of case studies and neuroscience research, Tammy makes the case that all of these things can be positively influenced by improving a site’s performance.
Tammy also worked with Tim Kadlec to create WPO stats, a site that catalogs years of web performance case studies directly linking web performance improvements to better business outcomes.
For example, in one case study, a Shopify site improved loading performance and layout stability by 25% and 61%, and saw a 4% decrease in bounce rate and 6% increase in conversions. In another case study, the Obama for America site improved performance by 60% and saw a corresponding increase in conversions of 14%. There are dozens of examples just like these.
Happy users make more money. If you think about the typical conversion funnel, fewer and fewer users make it deeper into the funnel. Optimizing performance effectively “greases the funnel” to drive conversions by giving users a more frictionless experience.
That’s the business impact, but even more fundamentally, performance is about the user experience.
How we’re doing
The modern web is the fastest it’s ever been, using Google’s measure of performance: Core Web Vitals. To put that in perspective, it’s helpful to look at how we got here.
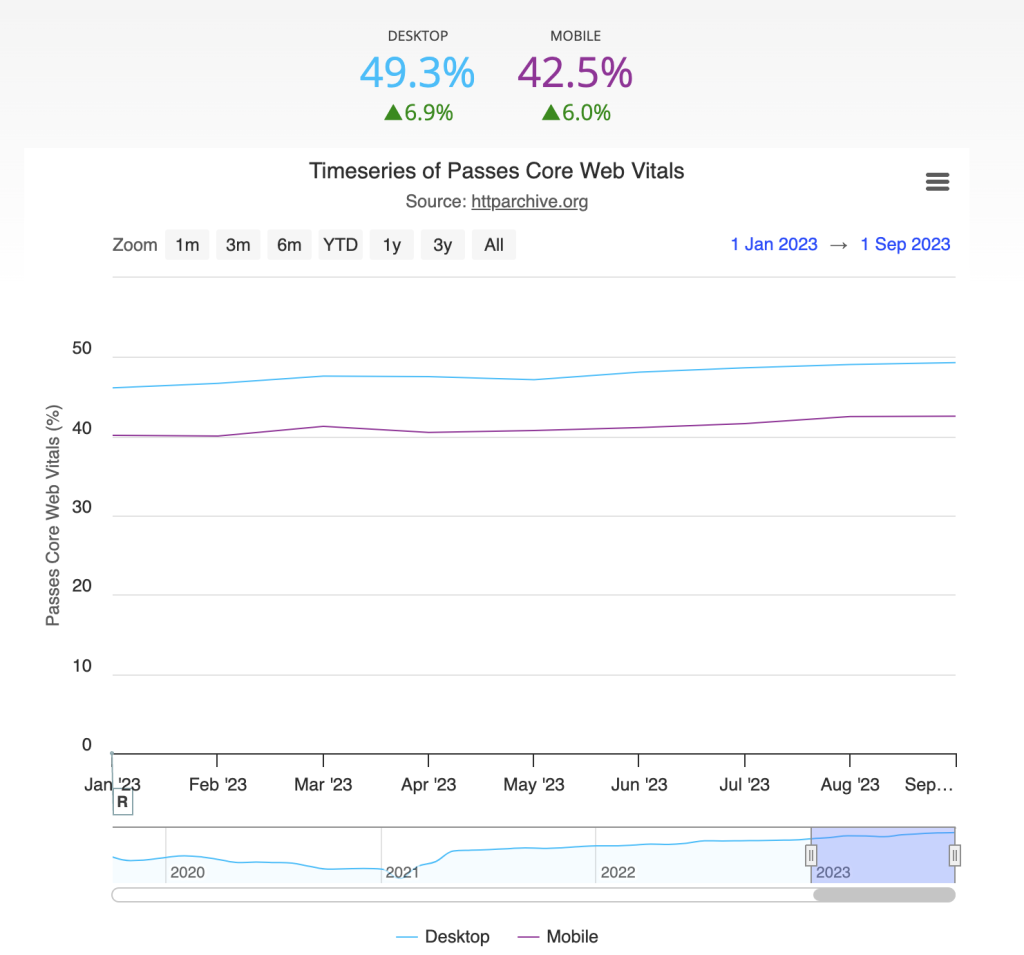
Source: HTTP Archive
At the start of 2023, 40.1% of websites passed the Core Web Vitals assessment for mobile user experiences. Since then, we’ve seen steady growth. As of September 2023, we’re at 42.5% of websites passing the Core Web Vitals assessment, an improvement of 2.4 percentage points, or 6.0%. This is a new high, representing an incredible amount of work by the entire web ecosystem.
This might seem like a glass half full / half empty situation. You could celebrate the positive story of nearly half of all websites having measurably good performance. Another equally valid way to look at it is that more than half of websites are not meeting the bar for performance.
We can have it both ways! It’s amazing that the web has improved so much, and at the same time we can push ourselves to continue this momentum into 2024.
Keeping pace
So, can we keep up the current pace of improvement and convert another 6% of websites to pass the assessment? I’d like to think that we can, but everything is about to change with the metric we use to assess page responsiveness.
Earlier this year, I wrote a blog post announcing that Interaction to Next Paint (INP) will become Google’s new responsiveness metric in the Core Web Vitals assessment, replacing First Input Delay (FID) in March 2024.
This is a very good change, as INP is much more effective at catching instances of poor responsiveness. As a result though, many fewer websites have good INP scores compared to FID, especially among mobile experiences.
In the Performance chapter of the 2022 Web Almanac, I wrote about what the Core Web Vitals pass rates would look like in a world with INP instead of FID.
For mobile experiences, only 31.2% of sites would pass the assessment, a drop of 8.4 percentage points (21.2%) from the FID standard. That was based on data from June 2022. How are we looking now?

Source: Chrome UX Report
Things are actually looking much better! The gap is all but closed on desktop, and mobile experiences are only trailing by 6 points (14.2%).
But the fact remains: pass rates will drop substantially once INP takes effect.
While it might seem like a step backwards at first, keep in mind that INP is giving us a much more accurate look at how real users are experiencing interaction responsiveness. Nothing about how the web is actually experienced is changing with INP—only our ability to measure it. In this case, a drop in the pass rates does not actually mean that the web is getting slower.
So I’m still optimistic that we’re going to see continued improvements in performance throughout 2024. We’re just going to have to recalibrate our expectations against the new baseline when INP hits the scene.
Regaining lost ground
FID is the oldest metric in the Core Web Vitals. It first appeared in the Chrome UX Report dataset in June 2018. As of today, only 5.8% of websites have any FID issues whatsoever on either desktop or mobile. So I think it’s fair to say that for the most part we haven’t really had to worry about interaction responsiveness.
INP challenges us to overcome five years of inertial complacency. To do it, we’re going to have to flex some web performance muscles we may not have used in a while, if ever. We’re going to have to break out some new tools.
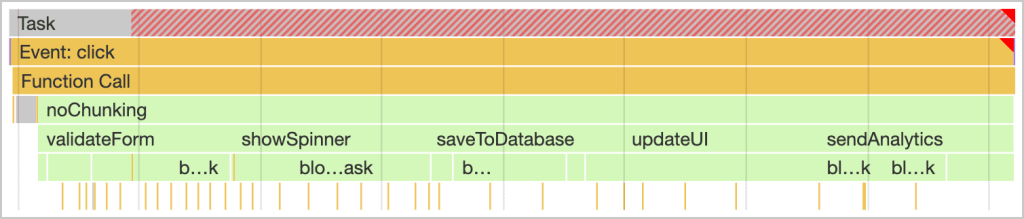
Source: Optimize Long Tasks on web.dev
We’re going to have to get very comfortable with this.
This is what a long task looks like in the Performance panel of Chrome DevTools. The red striping shows the amount of the task that exceeds the 50ms budget, making it a “long” task. If a user were to attempt to interact with the page at this time, the long task would block the page from responding, creating what the user (and the INP metric) would perceive to be a slow interaction.
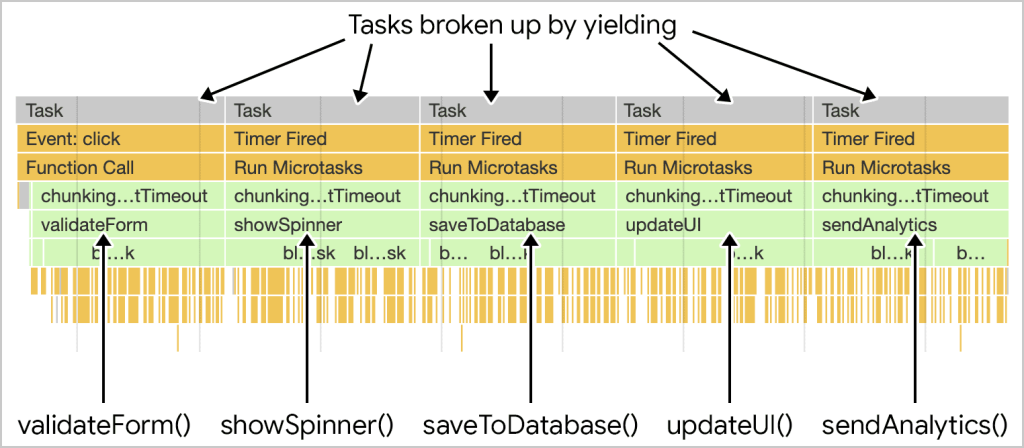
Source: Optimize Long Tasks on web.dev
The solution to this problem might require a web performance technique you’ve never tried before: breaking up long tasks. The same amount of work will get done eventually, but by adding yield points between major chunks of work, the page will be able to more quickly respond to any user interactions that happen during the task.
Chrome is experimenting with a couple of APIs in origin trials to help address problematic long tasks. The first is the scheduler.yield() API, which is designed to give developers more control over breaking up long tasks. It ensures that the work happens continuously, without other tasks cutting in.
Knowing which long tasks to break up is its own science. To help with this, Chrome is also experimenting with the Long Animation Frames API. Similar to the Long Tasks API, which reports when long tasks happen and for how long, the Long Animation Frames API reports on long rendering updates, which can be comprised of multiple tasks. Crucially, it also exposes much more actionable attribution info about the tasks, including the script source down to the character position in code.
Similar to tracking INP performance in analytics tools, developers could use the Long Animation Frames API to track why the INP was slow. In aggregate, this data can narrow down the root causes of common performance issues, saving developers from optimizing by trial and error.
These APIs aren’t stable yet, but they offer powerful new functionality to complement the existing suite of tools to optimize responsiveness. Even though it might feel like we’re playing catch-up just getting the pass rates back to where they were in a FID-centric assessment, the web is actually getting faster in the process!
The weakest link
It might seem like responsiveness will be the new bottleneck when INP takes over, but that’s actually not the case. Loading performance, as measured by the Largest Contentful Paint (LCP) metric, is and will still be the weakest link in the Core Web Vitals assessment.
Passing the Core Web Vitals assessment requires a site to be fast in all three metrics. So in order to continue the pace of improvement, we need to be looking at the metrics that need the most help.
54.2%
This is the percentage of websites with good LCP on mobile, compared to 64.1% and 76.0% for INP and CLS, according to HTTP Archive as of the September 2023 dataset.
As long as web performance has been a thing, developers have been talking about loading performance. Since the days of simple HTML applications, we’ve built up a lot of institutional knowledge around traditional techniques like backend performance and image optimization. But web pages have evolved a lot since then. They’ve become ever more complex with an increasing number of third party dependencies, richer media, and sophisticated techniques to render content on the client. Modern problems require modern solutions.
In 2022, Philip Walton introduced a new way of breaking down the time spent in LCP: the time to start receiving content on the client (TTFB), the time to start loading the LCP image (resource load delay), the time to finish loading the LCP image (resource load time), and the time until the LCP element is rendered (element render delay). By measuring which of these diagnostic metrics are slowest, we could focus our efforts on the optimizations that would most effectively improve LCP performance.
Conventional wisdom says that if you want your LCP image to appear sooner, you should optimize the image itself. This includes things like using a more efficient image format, caching it longer, resizing it smaller, and so on. In terms of the LCP diagnostic metrics, these things would only improve the resource load time. What about the rest?
Earlier I mentioned that last week I was at the performance.now() conference. Another one of the presenters was Estela Franco, who I collaborated with to share some brand new data sourced from real Chrome users on where this LCP time is typically spent.
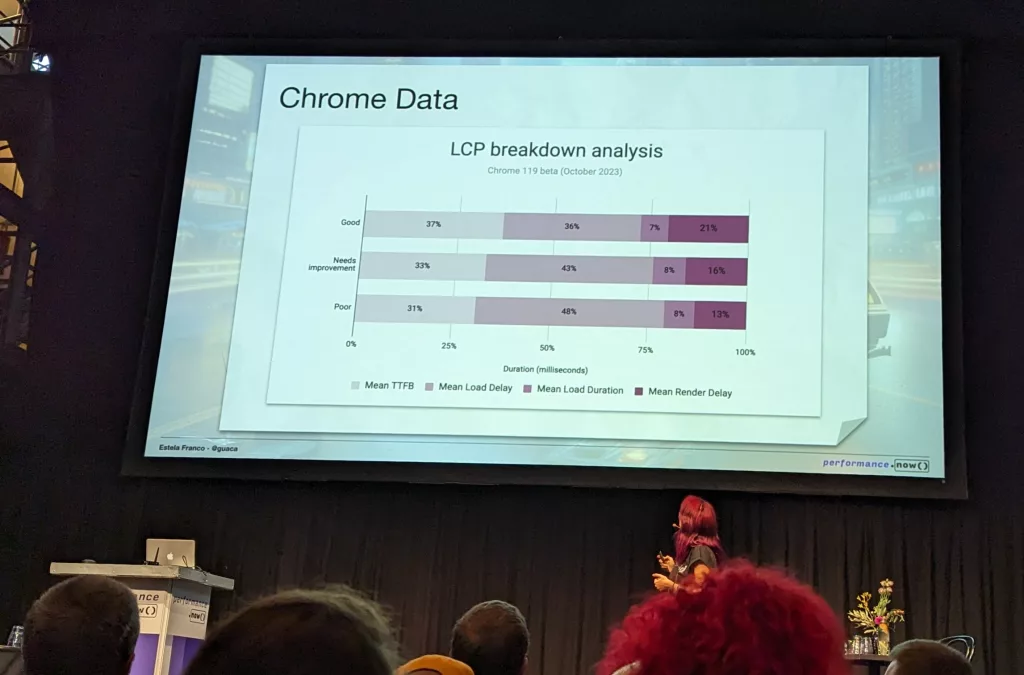
Photo credit: Rick Viscomi
The photo above shows Estela’s slide with the LCP diagnostics as a percentage of the mean LCP time. Here’s the same data presented in milliseconds:
| LCP score | Mean TTFB | Mean load delay | Mean load duration | Mean render delay |
|---|---|---|---|---|
| Good | 410 | 400 | 80 | 230 |
| Needs improvement | 1,020 | 1,350 | 260 | 490 |
| Poor | 2,330 | 3,670 | 580 | 990 |
Source: Chrome 119 beta internal data
What’s perhaps most surprising about this data is that the resource load time (load duration) is already the fastest LCP diagnostic. The slowest part is actually the resource load delay. Therefore, the biggest opportunity to speed up slow LCP images is to load them sooner. To reiterate, the problem is less about how long the image takes to load, it’s that we’re not loading it soon enough.
Browsers are usually pretty good about discovering images in the markup and loading them reasonably quickly. So why is this an issue? Developers aren’t making LCP images discoverable.
I also wrote about the LCP discoverability problem in the 2022 Web Almanac. In it, I reported that 38.7% of mobile pages that have an image LCP are not making it statically discoverable. Even if we look at the latest data from HTTP Archive, this figure is still at 36.0%.
A big part of the problem continues to be lazy loading. I first wrote about the negative performance effects of LCP lazy loading in 2021. Lazy loading is more than just the native loading=lazy attribute; developers can also use JavaScript to dynamically set the image source. Last year I reported that 17.8% of pages with LCP images lazy load them in some way. According to the latest data from HTTP Archive, we’ve improved slightly to 16.8% of pages. It’s not impossible to have a fast LCP if you lazy load the image, but it definitely doesn’t help. LCP images should never be lazy loaded.
To be clear: lazy loading is good for performance, but only for non-critical content. Everything else, including LCP images, must be loaded as eagerly as possible.
A totally different problem is client-side rendering. If the only markup you’re sending to the client is a <div id="root"></div> container that gets rendered by JavaScript, the browser can’t load the LCP image until it’s eventually discovered in the DOM. A better (if controversial) solution is to switch to a server-side rendering model.
We also need to contend with LCP images declared in CSS background styles. For example, background-image: url("cat.gif“). These images will not be picked up by the browser’s preload scanner, and so they won’t get the benefit of loading as early as possible. Using a plain old <img src="cat.gif"> element will get the job done.
In each of these cases, it’s also possible to use declarative preloading to make the images explicitly discoverable. In its simplest form, the code looks like this:
<link rel="preload" as="image" href="cat.gif">Code language: HTML, XML (xml)Browsers will start loading the image sooner, but as long as its rendering is dependent on JavaScript or CSS, you may just be shifting from a load delay problem to a render delay problem. Eliminating these dependencies by putting the <img> directly in HTML is the most straightforward way to avoid this delay.
New tricks
So far all of these LCP recommendations are basically to dismantle some of the complexities we’ve introduced into our applications: LCP lazy loading, client-side rendering, and LCP background images. There are also some relatively new, additive techniques we could use to improve performance or even to avoid these delays altogether.
In last year’s Web Almanac, I reported that 0.03% of pages use fetchpriority=high on their LCP images. This attribute hints to the browser that it should be loaded higher than its default priority. Images in Chrome are typically low priority by default, so this can give them a meaningful boost.
A lot has changed since last year! In the most recent HTTP Archive dataset, 9.25% of pages are now using fetchpriority=high on their LCP images. This is a massive leap, primarily due to WordPress adopting fetchpriority in version 6.3.
There are also a couple of techniques you can use to effectively get instant navigations: leveraging the back/forward cache and speculative loading.
When a user hits the back or forward buttons, a previously visited page is resumed. If the page was stored in the browser’s in-memory back/forward cache (also referred to as the bfcache) then it would appear to be loaded instantly. That LCP image will already be loaded and any of the JavaScript needed to render it will have already run. But not all pages are eligible for the cache. Things like unload listeners or Cache-Control: no-store directives currently* make pages ineligible for Chrome’s cache, even if those event listeners are set by third parties.
In the year since I last reported on bfcache eligibility for the Web Almanac, unload usage dropped from 17% to 12% of pages, and no-store usage dropped less significantly from 22% to 21%. So more pages are becoming eligible for this instant loading cache, which benefits all Core Web Vitals metrics.
The other instant navigation technique is called speculative loading. Using the experimental Speculation Rules API, developers can hint to the browser that an entire page should be prerendered if there’s a high likelihood that the user will navigate there next. The API also supports prefetching, which is a less aggressive way to improve loading performance. The drawback is that it only loads the document itself and none of its subresources, so it’s less likely to deliver on the “instant navigation” promise than prerender mode.
Here’s an example of speculative loading in action, from the MDN docs:
<script type="speculationrules">
  {
    "prerender": [
      {
        "source": "list",
        "urls": ["next3.html", "next4.html"]
      }
    ]
  }
</script>Code language: HTML, XML (xml)
Both of these optimizations leverage different kinds of prerendering. With the bfcache, previously visited pages are preserved in memory so that revisiting them from the history stack can happen instantly. With speculative loading, the user doesn’t need to have ever visited the page for it to be prerendered. The net effect is the same: instant navigations.
The way forward
As more and more developers become aware of the challenges and opportunities to improve performance, I’m hopeful that we can see the continued growth of sites passing the Core Web Vitals assessment that we saw to date in 2023.
The first hurdle to clear is to even know that your site has a performance problem. PageSpeed Insights is the easiest way to run an assessment of your site, using public Core Web Vitals data from the Chrome UX Report. Even if you’re currently passing the assessment, pay close attention to your Interaction to Next Paint (INP) performance, as that will become the new standard for responsiveness in March 2024. You can also monitor your site’s performance using the Core Web Vitals report in Google Search Console. An even better way to understand your site’s performance is to measure it yourself, which enables you to get more granular diagnostic information about why it may be slow.
The next hurdle is to be able to invest time, effort, and maybe some money in improving performance. To do this, your organization first needs to care about web performance.
If your site has poor INP performance, there’s probably going to be a learning curve to start making use of all of the unfamiliar documentation, techniques, and tools to optimize long tasks. First Input Delay (FID) has given us something of a false sense of security when it comes to interaction responsiveness, but now we have an opportunity to find and fix the issues that would have otherwise been frustrating our users.
And even though INP is new and shiny, we can’t forget that Largest Contentful Paint (LCP) is the weakest link in the Core Web Vitals assessment. More sites struggle with LCP than any other metric. The way we’ve been building web apps over the years has changed, and so we need to adapt our optimization techniques accordingly by focusing beyond making images faster.
In lieu of the 2023 edition of the Web Almanac, I hope this post helps to demonstrate some of the progress we’ve seen this year and the room for improvement. The web is 6% faster, and that’s certainly worth celebrating. But most sites are still not fast—yet.
If we maintain the current rate of change of 6% per year, in 2026 more than half of sites will have good Core Web Vitals on mobile. So here’s my challenge. Let’s continue pushing our sites, our CMSs, our JavaScript frameworks, and our third party dependencies faster. Let’s continue to be advocates for better (if not instant) performance best practices in the web community. Here’s to the next 6% in 2024!
This post draws from the work of many people in the web performance community to whom I owe my thanks, including: Tammy Everts, Tim Kadlec, Estela Franco, Philip Walton, Mateusz Krzeszowiak, Annie Sullivan, Addy Osmani, Patrick Meenan, Jeremy Wagner, Barry Pollard, Brendan Kenny, and Felix Arntz.
Leave a Reply